
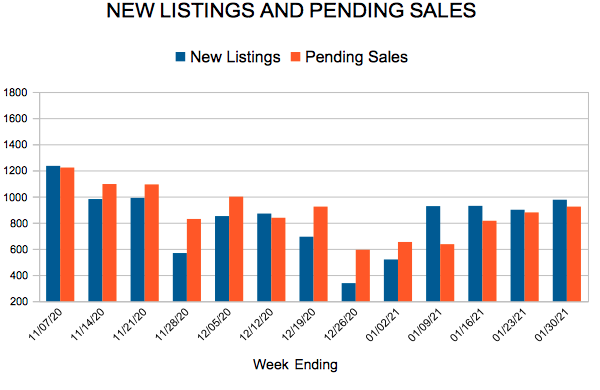
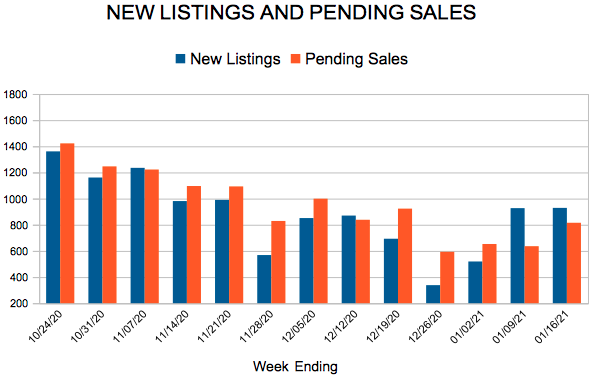
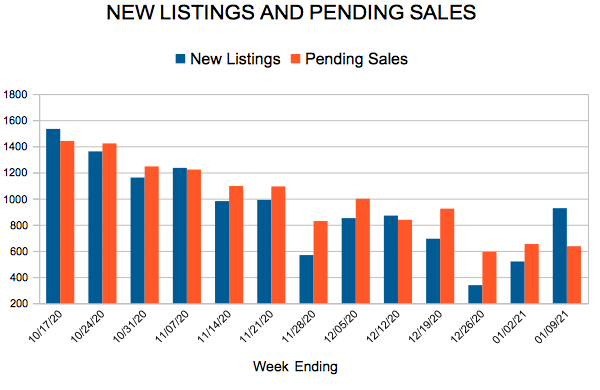
New Listings and Pending Sales
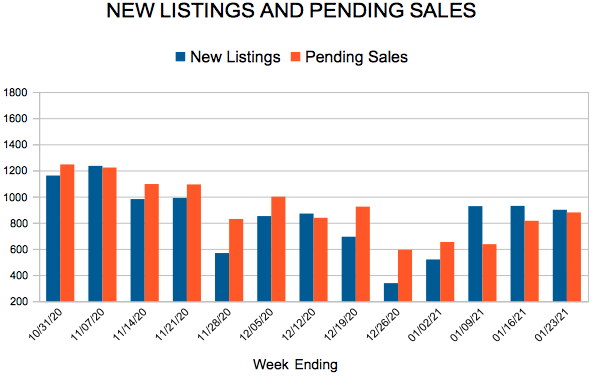
Seller activity rose a modest 0.1 percent from 2019 while closed sales were up 7.7 percent. That marks the highest sales figure since at least 2003 and the highest new listings count since 2016. Listing activity was constrained due to health concerns, remodeling activity, a lack of options and homeowners staying in their homes longer.
“Predictably, the result of record sales combined with ultra-low inventory meant rising prices and sellers accepting stronger offers in less time,” according to Tracy Baglio, President of the Saint Paul Area Association of REALTORS®.
Governor Walz’s shelter-in-place order paused market activity in April and May, which created pent-up demand that pushed the spring market into summer and the summer market into fall. Buyers were still more eager to purchase than sellers were to list, meaning multiple offers remained commonplace—particularly at the more affordable price points where the inventory shortage is even more pronounced.
“Despite several challenges, the Twin Cities housing market exceeded all expectations,” said Todd Walker, President of Minneapolis Area REALTORS®. “Inventory remained a hurdle, but homeowners have never had so much equity in their homes and buyers haven’t seen rates this low in 50 years, offsetting rising prices.”
The median sales price rose 8.9 percent to $305,000, a record high. On average, sellers obtained 99.8 percent of their list price—the highest since at least 2003. Homes sold quickly. Half the sales had accepted offers in under 18 days. Importantly, all areas, price points and property types are unique.
Signed contracts rose 10.0 percent in Minneapolis and 16.4 percent in St. Paul, suggesting core cities remain attractive. With prices slightly lower, market times higher and offers weaker, the condo market continues to lag other segments. Aided by favorable jumbo rates and a recovered stock market, sales of luxury properties ($1M+) have been soaring higher—up 25.4 percent from 2019.
One thing is clear: the housing market continues to outperform, despite several headwinds.
2020 by the numbers (compared to 2019)
• Sellers listed 76,348 properties on the market, a 0.1 percent increase from 2019
• Buyers closed on 64,479 properties, up 7.7 percent (65,770 pending sales, up 9.7 percent)
• The Median Sales Price rose 8.9 percent to $305,000
• Inventory levels fell 39.3 percent to 5,080 units
• Months Supply of Inventory was down 47.1 percent to 0.9 months (5-6 months is balanced)
• Days on Market decreased 12.2 percent to 43 days, on average (median of 18, down 21.7 percent)
• Changes in Sales activity varied by market segment
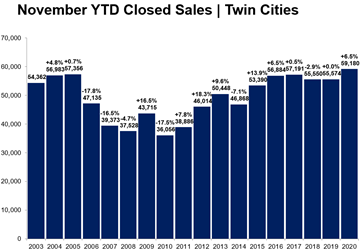
(December 17, 2020) – According to new data from the Minneapolis Area REALTORS® and the Saint Paul Area Association of REALTORS®, the growth in buyer and seller activity in the 16-county Twin Cities metro continues to climb above 2019 levels. Seller activity rose 1.3 percent from last November while new purchase agreements were up 13.4 percent over last year. That marks the strongest November pending sales figure since 2004 and the highest closed sales since at least 2003.
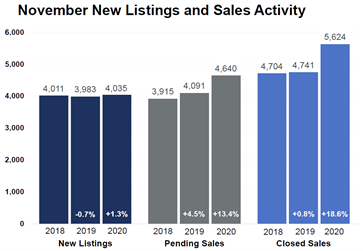
This year, the fall and winter markets are behaving more like a spring market since activity was delayed from the spring and summer months. While sellers only listed slightly more units than last November, pending and closed sales were up significantly. Pending sales often act as a leading indicator of future demand while closings lag.“The Twin Cities housing market continues to exceed expectations,” according to Patrick Ruble, President of the Saint Paul Area Association of REALTORS®. “Despite record sales figures, the lack of adequate supply—particularly affordable units—continues to frustrate buyers.”
Historically low mortgage rates, shifting work and learning patterns, health concerns and other factors are driving this sellers’ market. While all areas and price points are unique, sellers are getting strong offers early on. On average, sellers obtained 100.2 percent of their original list price—the highest November figure since at least 2003. At a median of 15 days, homes went under contract in record time, and 48.3 percent faster than last November.
“It’s truly impressive that sales would reach new highs during a pandemic and an otherwise challenging year,” said Linda Rogers, President of Minneapolis Area REALTORS®. “That’s of course meant rising home prices, but luckily, ultra-low interest rates have been able to partly offset that.”
Sales were up 21.5 percent in Minneapolis and 30.8 percent in St. Paul, suggesting buyers are eager to quickly snap up any new listings. And the competitive landscape means those buyers are often going above list price. With prices slightly lower, market times higher and offers weaker, the condo market continues to lag other segments. However, sales of luxury properties ($1M+) have been soaring higher—up nearly 20.0 percent YTD. One thing is clear: the housing market continues to outperform, despite the many economic headwinds.
November 2020 by the numbers compared to a year ago